
on your Fib retrace tool, include 1.27; 1.618; 2.618; 4.236; 6.854; 11.090
Go to the start of an up-trend and draw your retrace from the first high to the low; do the same in reverse for the start of a down-trend
Now see how price reacts at the big fib levels.
This isn't really a great discovery but including these levels on your fib retrace (or expansion) tool is clearly useful. I've not come across anyone referring to the fib levels beyond 2.618, which surprises me.
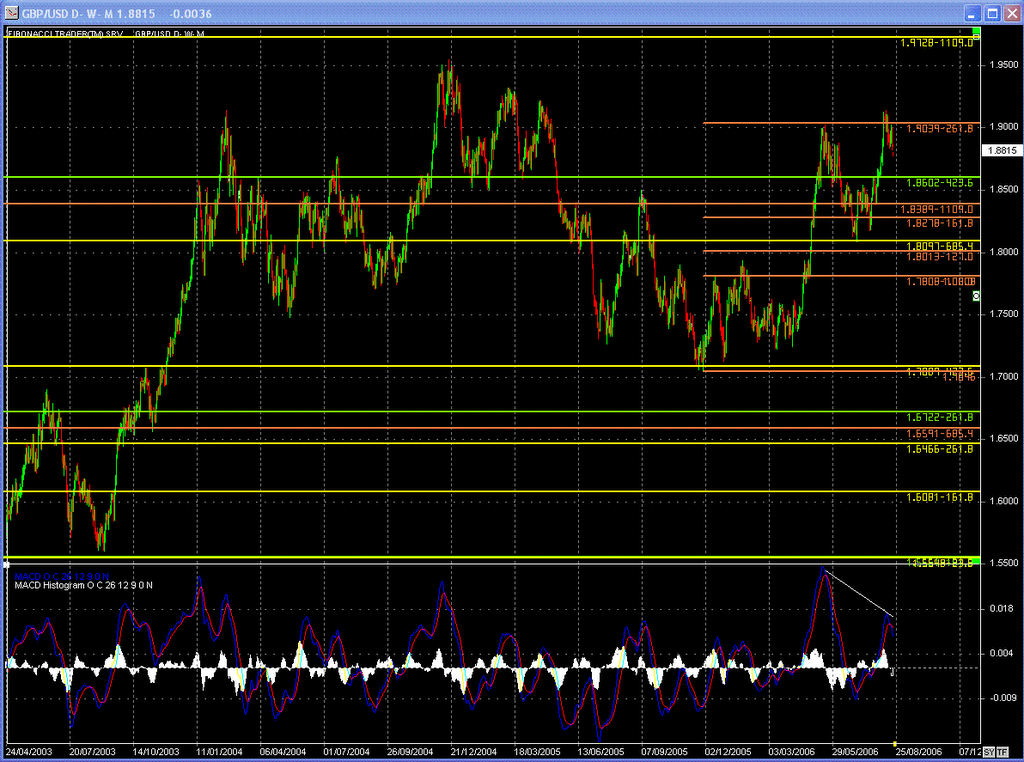
Take cable for example:
Do a fib tretrace from the high of 15th June 2001 to the low 12th June (1.4106 to 1.3682)
Note how price congests from mid July to Oct 2002 around the 423.6 level before finding support there at the end of November. Price almost makes it to the 685.4 level before falling to bottom out again on the 423.6 level in April 2003.
For much of 2004, price hangs around the 1109 level and on 11/11/04 (coincidence?) it gains a foothold on this level and up it goes.
Just a few weeks ago, on 25th July, the 1109 level provided support again, to rally nearly 800 pips.
About six years after the first ripple of the up-trend, the higher fib levels provde remarkable support and resistance for the following waves, if not S&R then areas of congestion while price thinks about where to go.
Plot the same levels from the high to low 17th April to 7th April 2003 and check out the 423.6 & 685.4 levels (especially 29th June 2006).
As with all things Fibonacci, these higher levels work well on all time frames and shouldn't be ignored.

Footnote:
It's interesting to note (or maybe not) that the difference (5256 pips) between the close on the 12/6/01 at 13744 and the close on 8/8/06 at 19000 is 38.2% of 13744. It's taken 1573 days to get to 19000 blah blah blah blah ... ok bored now.
No comments:
Post a Comment